
(Part of our Optimising Profit series.)
If you increase your prices by 5% or your volume by 5%, the effect on profit will be quite different. Likewise, if you increase your price by 5% and lose 5% of your volume, will your net profit be the same? (Unlikely).
Knowing the key profit drivers for your business is the most critical part of ensuring you have a successful business, but we have found that many business owners and managers are so caught up in the day to day activities, that they never take the time to focus on the big picture. For all businesses, profit comes down to only three things. 1 – Revenue, 2 – Cost of Goods (or Cost of Sales) and 3 – Efficiency of operations.
This article will focus on Price vs Volume. Revenue is simply the number of widgets sold multiplied by the widget price. Price times volume!
Understanding the relationship between price and volume and how that affects profit is essential for setting your business strategy. Some businesses may choose to sell at a low price to gain volume, while others choose a premium price and accept lower volume. Let’s look at what this does to the profit.
For every business and every stage of development, this relationship will be different. One of the first things we do with many businesses is to analyse this so that managers can make informed strategic decisions. It helps to graph this relationship.
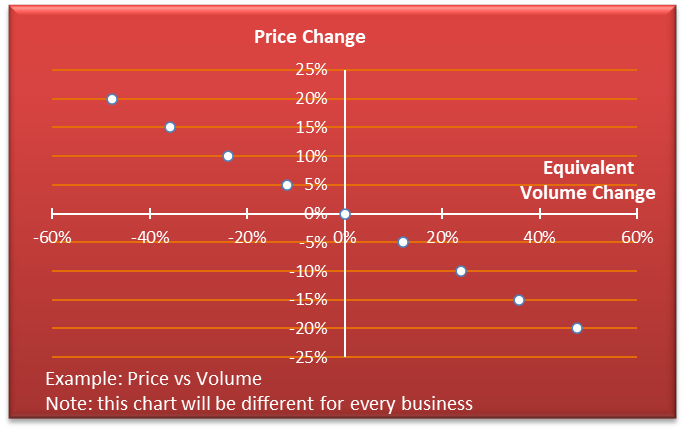
As you can see from the above graph, for this business a price decrease of 10% would need a volume increase of 24% to make the same profit. Alternatively, a price increase of 5% would increase profits unless volume dropped by more than 12%.
This assumes fixed costs do not vary. In reality, however, as a business grows, fixed costs will also grow. So, it’s a good idea to check this annually.
Calculating this ratio?
If you would like to do this yourself, you need some basic math skills, but most importantly you need a good chart of accounts and accurate bookkeeping. The chart of accounts is the categories used to record revenue, costs and expenses in your accounting system. Too often we see businesses not recording the important information needed to make good decisions. Don’t panic though, if you do not have a good chart of accounts, it’s not too hard to fix.
Once you have the data, the formula is simple:
Equivalent Volume Change = Revenue/(Revenue-Variable Costs) x -1
In the example above:
1.8million/(1.8million-1million) x -1 = -2.4. Therefore a 10% price change is equivalent to a -24% volume change.
Our small team of consultants have over 100 years of business ownership and management between them. We understand what to look for to optimise profit, and because we are looking from the outside with fresh eyes, we often see what has not been seen before. If you would like more information on optimising profit, contact us.